Variability of Hard Drive Speed
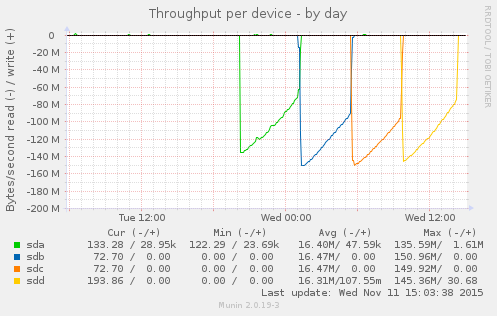
Munin gives me this beautiful graph:
This is the result of:
$ for s in a b c d; do echo ; echo sd${s} ; sudo dd if=/dev/sd${s} of=/dev/null; done

sda
3907029168+0 records in
3907029168+0 records out
2000398934016 bytes (2.0 TB) copied, 17940.3 s, 112 MB/s

sdb
3907029168+0 records in
3907029168+0 records out
2000398934016 bytes (2.0 TB) copied, 15457.9 s, 129 MB/s

sdc
3907029168+0 records in
3907029168+0 records out
2000398934016 bytes (2.0 TB) copied, 15119.4 s, 132 MB/s

sdd
3907029168+0 records in
3907029168+0 records out
2000398934016 bytes (2.0 TB) copied, 16689.7 s, 120 MB/s
The back story is that I had a system with two bad disks, which seems a little weird. I replaced the disks and I am trying to kick some tires before I put the system back into service. The loop above says “read each disk in turn in its entirety.” Prior to replacing the disks, a loop like the above would cause the bad disks, sdb, and sdc, to abort read before completing the process.
The disks in this system are 2TB 7200RPM SATA drives. sda and sdd are Western Digital, while sdb and sdc are HGST. This is in no way intended as a benchmark, but what I appreciate is the consistent pattern across the disks: throughput starts high and then gradually drops over time. What is going on? Well, these are platters of magnetic discs spinning at a constant speed. When you read a track on the outer part of the platter, you get more data than when you read from closer to the center.
I appreciate the clean visual illustration of this principle. On the compute cluster, I have noticed that we are more likely to hit performance issues when storage capacity gets tight. I had some old knowledge from FreeBSD that at a certain threshold, the OS optimizes disk writes for storage versus speed. I don’t know if Linux / ext4 operates that way. It is reassuring to understand that, due to the physical properties, traditional hard drives slow down as they fill up.


Comment
Tiny Print:
<a href="" title=""> <abbr title=""> <acronym title=""> <b> <blockquote cite=""> <cite> <code> <del datetime=""> <em> <i> <q cite=""> <s> <strike> <strong>